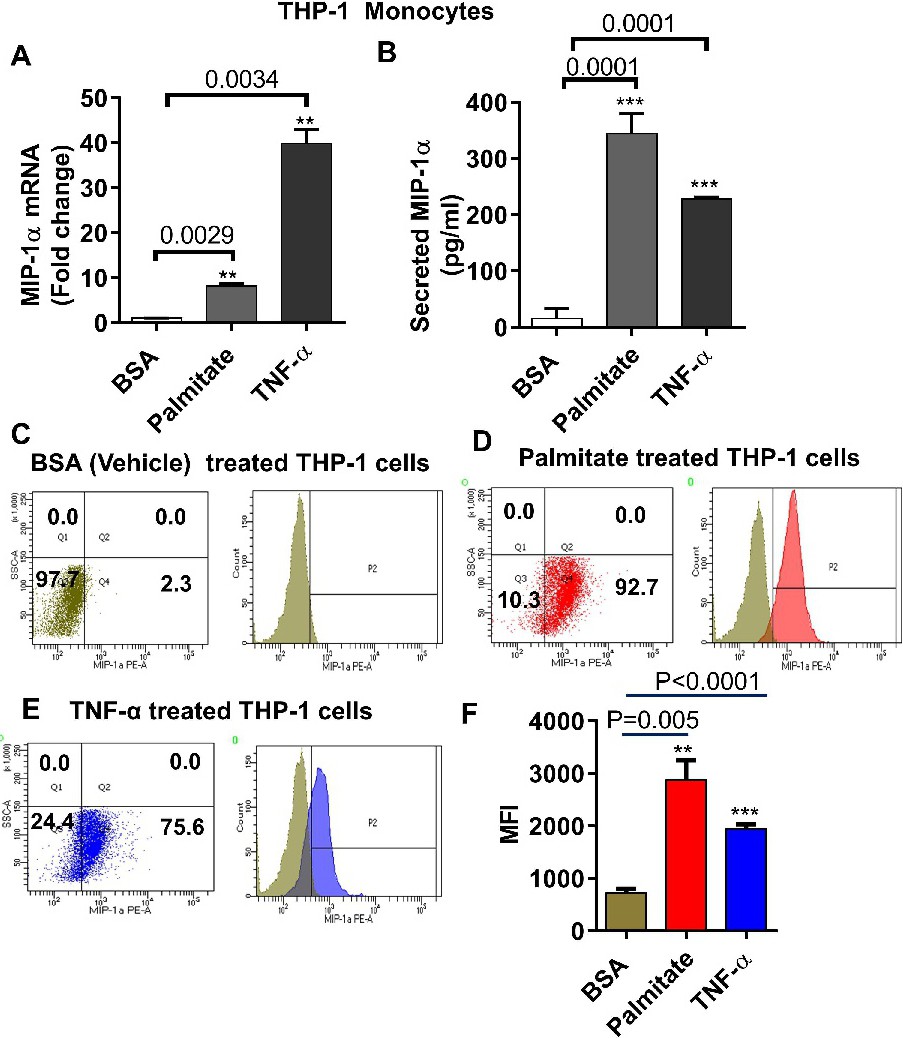
Fig. 1. Effect of palmitate on MIP-1α production in human monocytic cells. THP-1 cells were incubated with 0.1% BSA (vehicle) palmitate (100uM), TNF-a (10ng/ml; a positive control) for 24 hrs. Cells and culture media were collected. RNA was isolated and MIP-1α mRNA was quantified by real time PCR (A). MIP-1α protein in culture media was determined by ELISA (B). Analysis of MIP-1α expression using intracellular flow cytometry. Flow cytometry data are presented in flow dots plot (left) and histogram (right) (C-E). Bar graphs depict mean values ± SEM of fluorescence intensity (MFI) for MIP-1α (F). Data are represented as mean ±SEM. Statistical analysis was done using t-test. P<0.05 was considered as statistically significant (* P<0.01; **P< 0.001, ***P< 0.0001). The data in all Fig.s are representative of three independent experiments.